Algorithms are normally represented in two basic ways i.e using pseudocodes and using flowcharts.
Pseudocodes are used to represent algorithms textually using a combination of a higher level language and some basic programming constructs.
Flowcharts, on the other hand are used to represent the steps in an algorithm visually.
A flowchart is a diagrammatic representation which illustrates the solution model of a computation problem. Flowcharts shows the steps using some established shapes. Arrows are used to connect the shapes.
Shapes and Symbols used in flowcharts
Flow lines
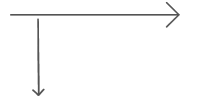
Used to show the next step in the flowcharts flow, the default flow is from left to right and top to bottom. By convention, the arrow head are only shown when the flow lines go contrary to the normal.
Terminal

The rounded rectangle is used to show the flowcharts starting and ending points
input/output

The parallelogram symbol is used to designate an input or output operation.
Processing

The rectangle is used to show that the computer is performing a certain operation e.g mathematical computation.
Decision

The diamond symbol is used to show the true/false condition being tested when a logical branch is encountered.
On-Page Connector

A circle with a small letter or number inside is used to connect flowcharts in the same page. This usually happens when a flowchart doesn't fit in a given section of a page.
Off-page Connector

This symbol is used to connect parts of a flowchart which spans in multiple pages.
There are several other symbols used to represent advanced features and operations.
Examples of programming flowcharts
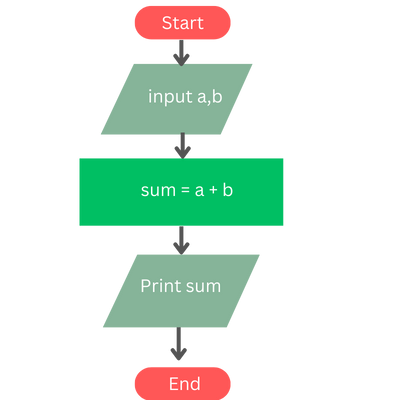
A flowchart for a program to add two numbers:
Flowchart of a program to print the larger of two numbers:
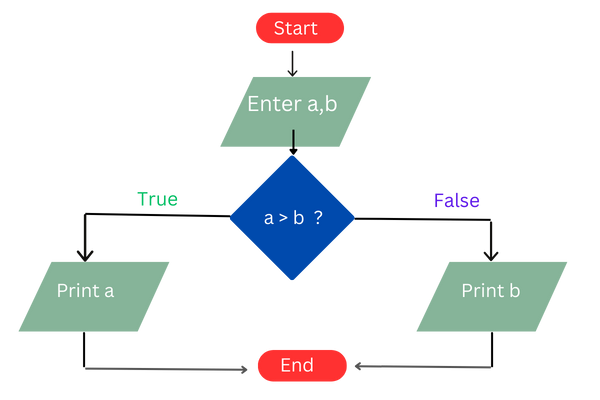
The section below shows pseudocode for the above flowchart.
start
input number1
a ← number1
input number2
b ← number2
if a > b :
   print a
else :
   print b
end
A flowchart to print the largest of three numbers:
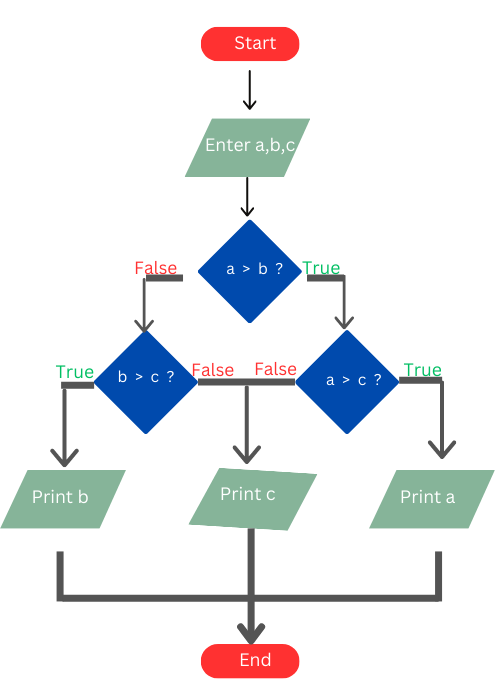
The pseudo-code for the above flowchart:
start
input number1, number2 & number3
a, b, c ← number1, number2, number3
if a > b :
   if a > c:
      print a
else:
    if b > c :
       print b
    else:
       print  c
end
Advantages of flowcharts
- They are used as a guide to programmers during the writing of the source code in a high-level language.
- They can be used in the debugging process to locate a flaw in the programs implementation.
- They offer an intuitive model to communicate the logic of the program.
- Flowcharts can be used as a guide during the testing process
- Can be referenced during future program maintenance
Disadvantages of flowcharts
-
Designing flowcharts is a time-consuming process.
-
Designing flow charts for complex programs can get more tedious than the actual implementation of the program.
-
It is hard to modify an existing flowchart.
